Visualizing regression models with the visreg package
Philina English passed on some code using the visreg R package for quickly plotting predictions and confidence intervals from regression models:
# Example model from ?glm:
# An example with offsets from Venables & Ripley (2002, p.189)
utils::data(anorexia, package = "MASS")
model <- glm(Postwt ~ Prewt + Treat + offset(Prewt),
  family = gaussian, data = anorexia)

library("visreg")
visreg(model, "Prewt", scale = "response")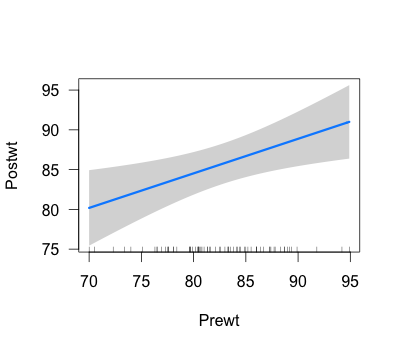
You can also extract the data to make a custom plot yourself:
v <- visreg(model, "Prewt", scale = "response")
model.fit <- v$fit # save dataframe
model.fit$visregFit # column of predicted values
model.fit$visregUpr # column of upper CI
model.fit$visregLwr # column of lower CI
# Now make your own plot with points() and lines()